Integrated 3FS
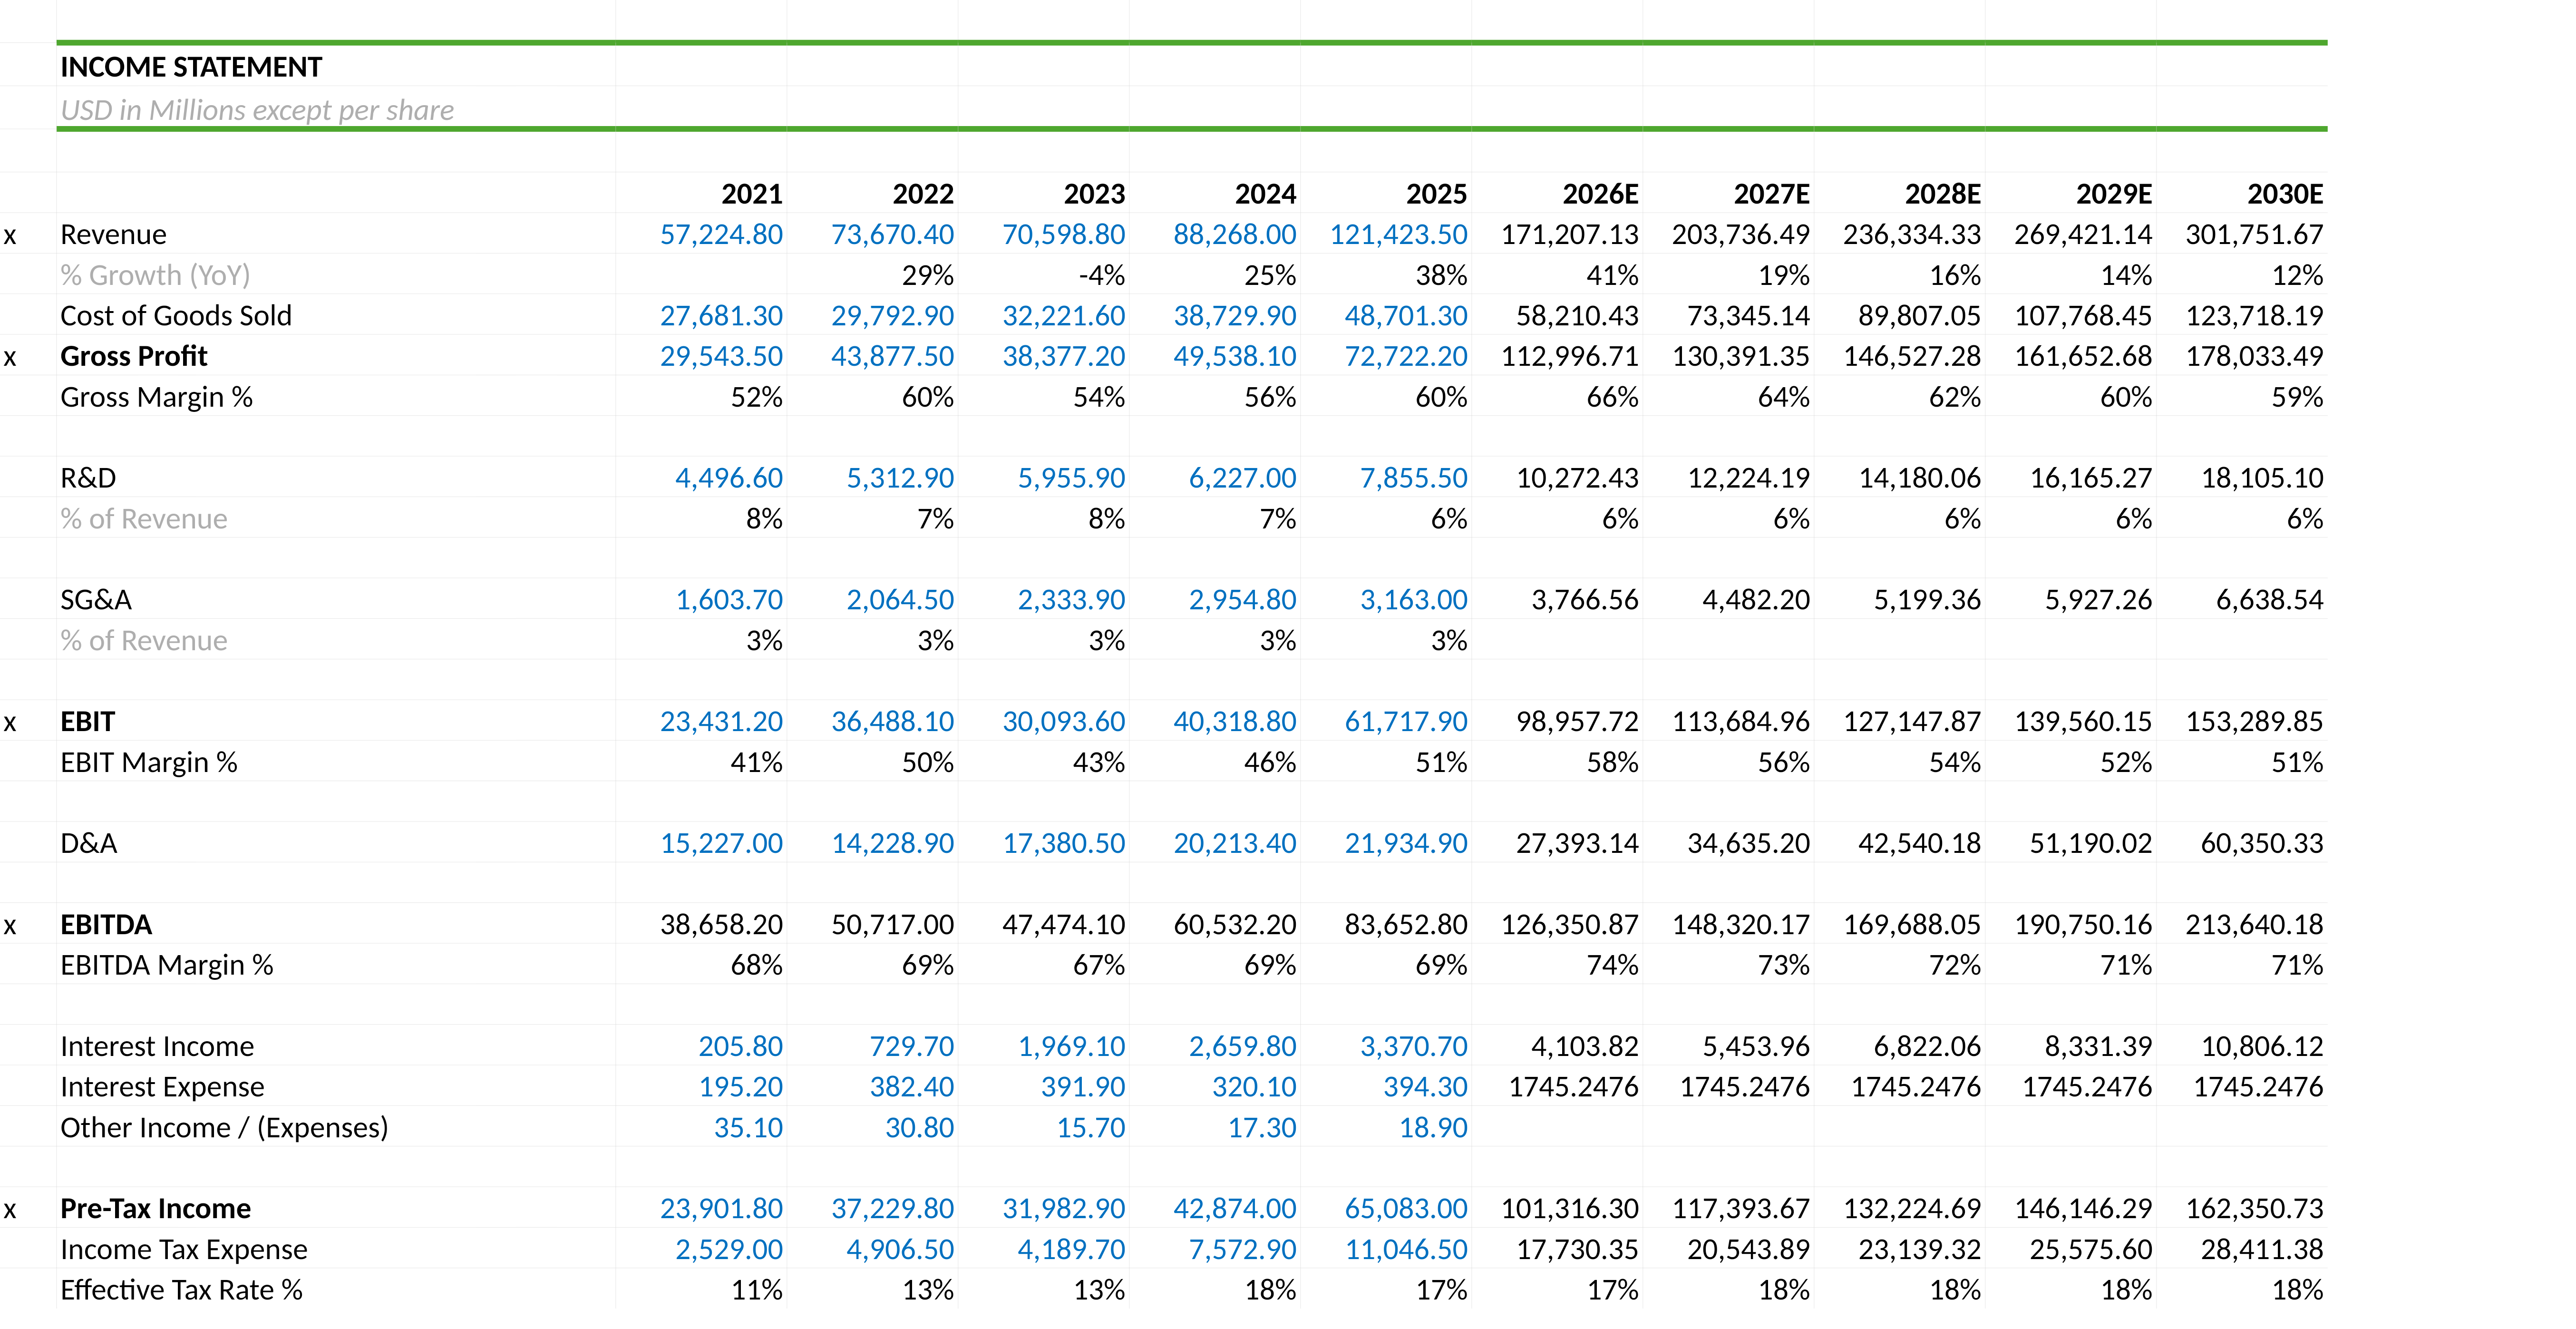
Income statement, balance sheet and cash flow statement linked through a unified forecast framework.
Financial Modelling · Excel
An integrated financial model combining operating forecasts, supporting schedules, three-statement integration, DCF valuation, trading comparables and scenario analysis.
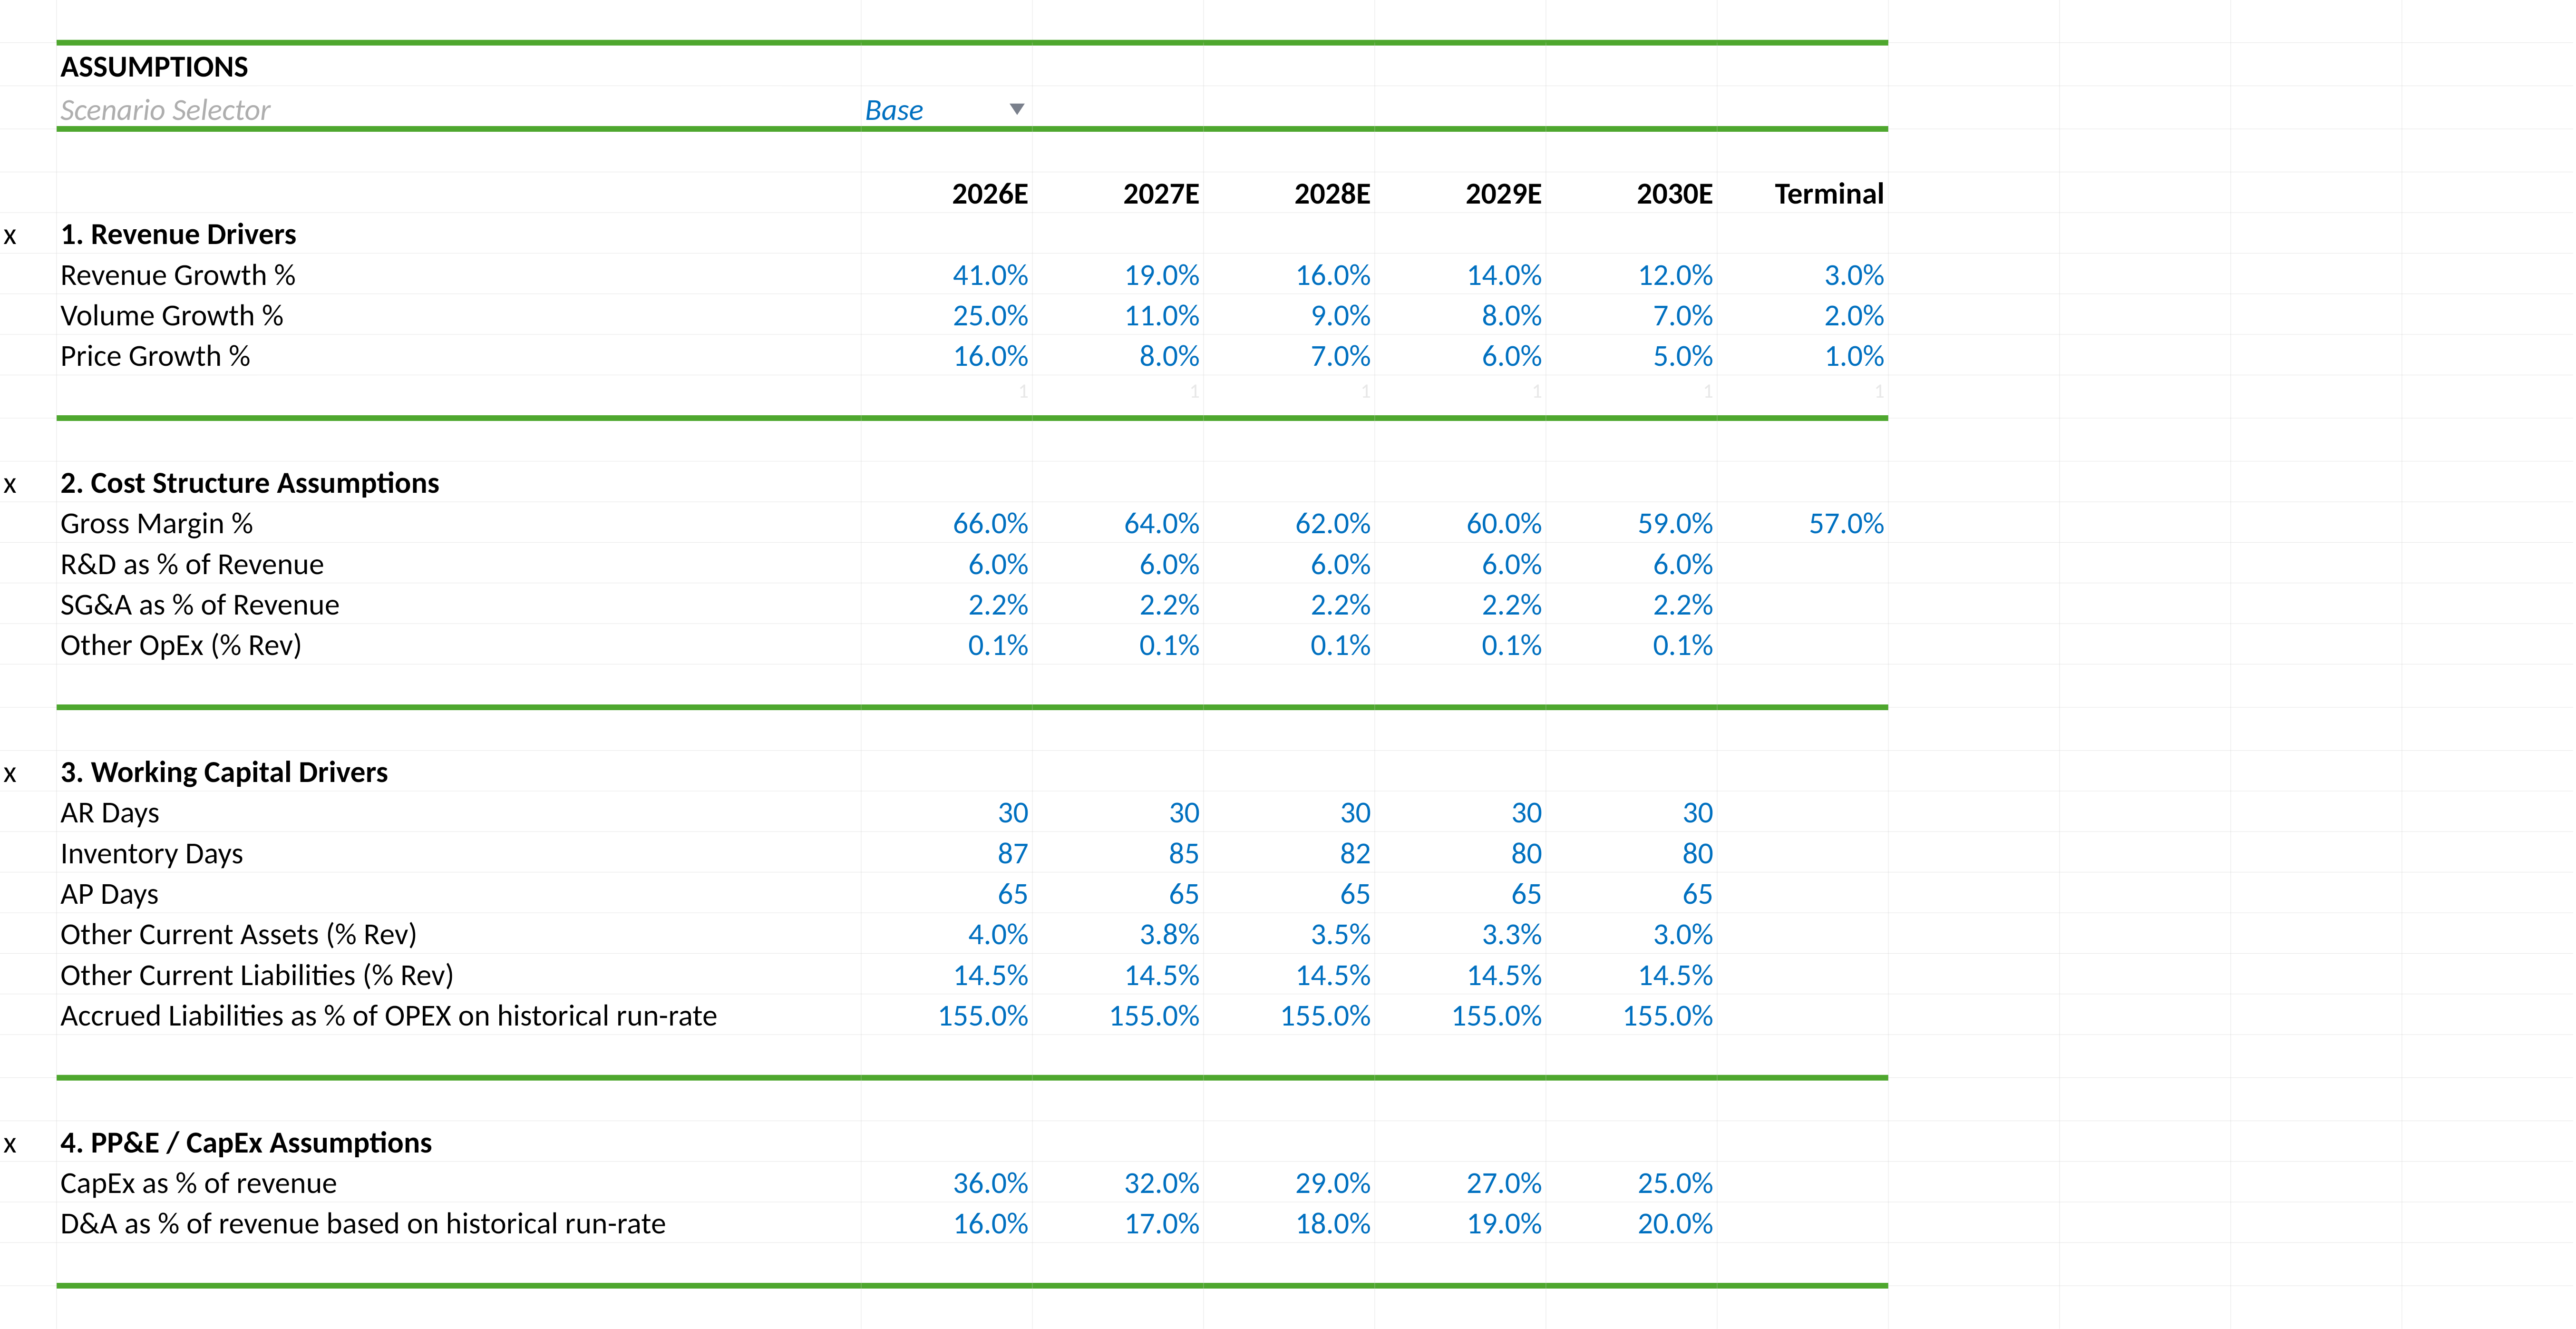
Operating drivers, scenarios, valuation and financing inputs.
Income statement, balance sheet and cash flow linked dynamically.
PP&E, working capital and marketable securities rollforwards.
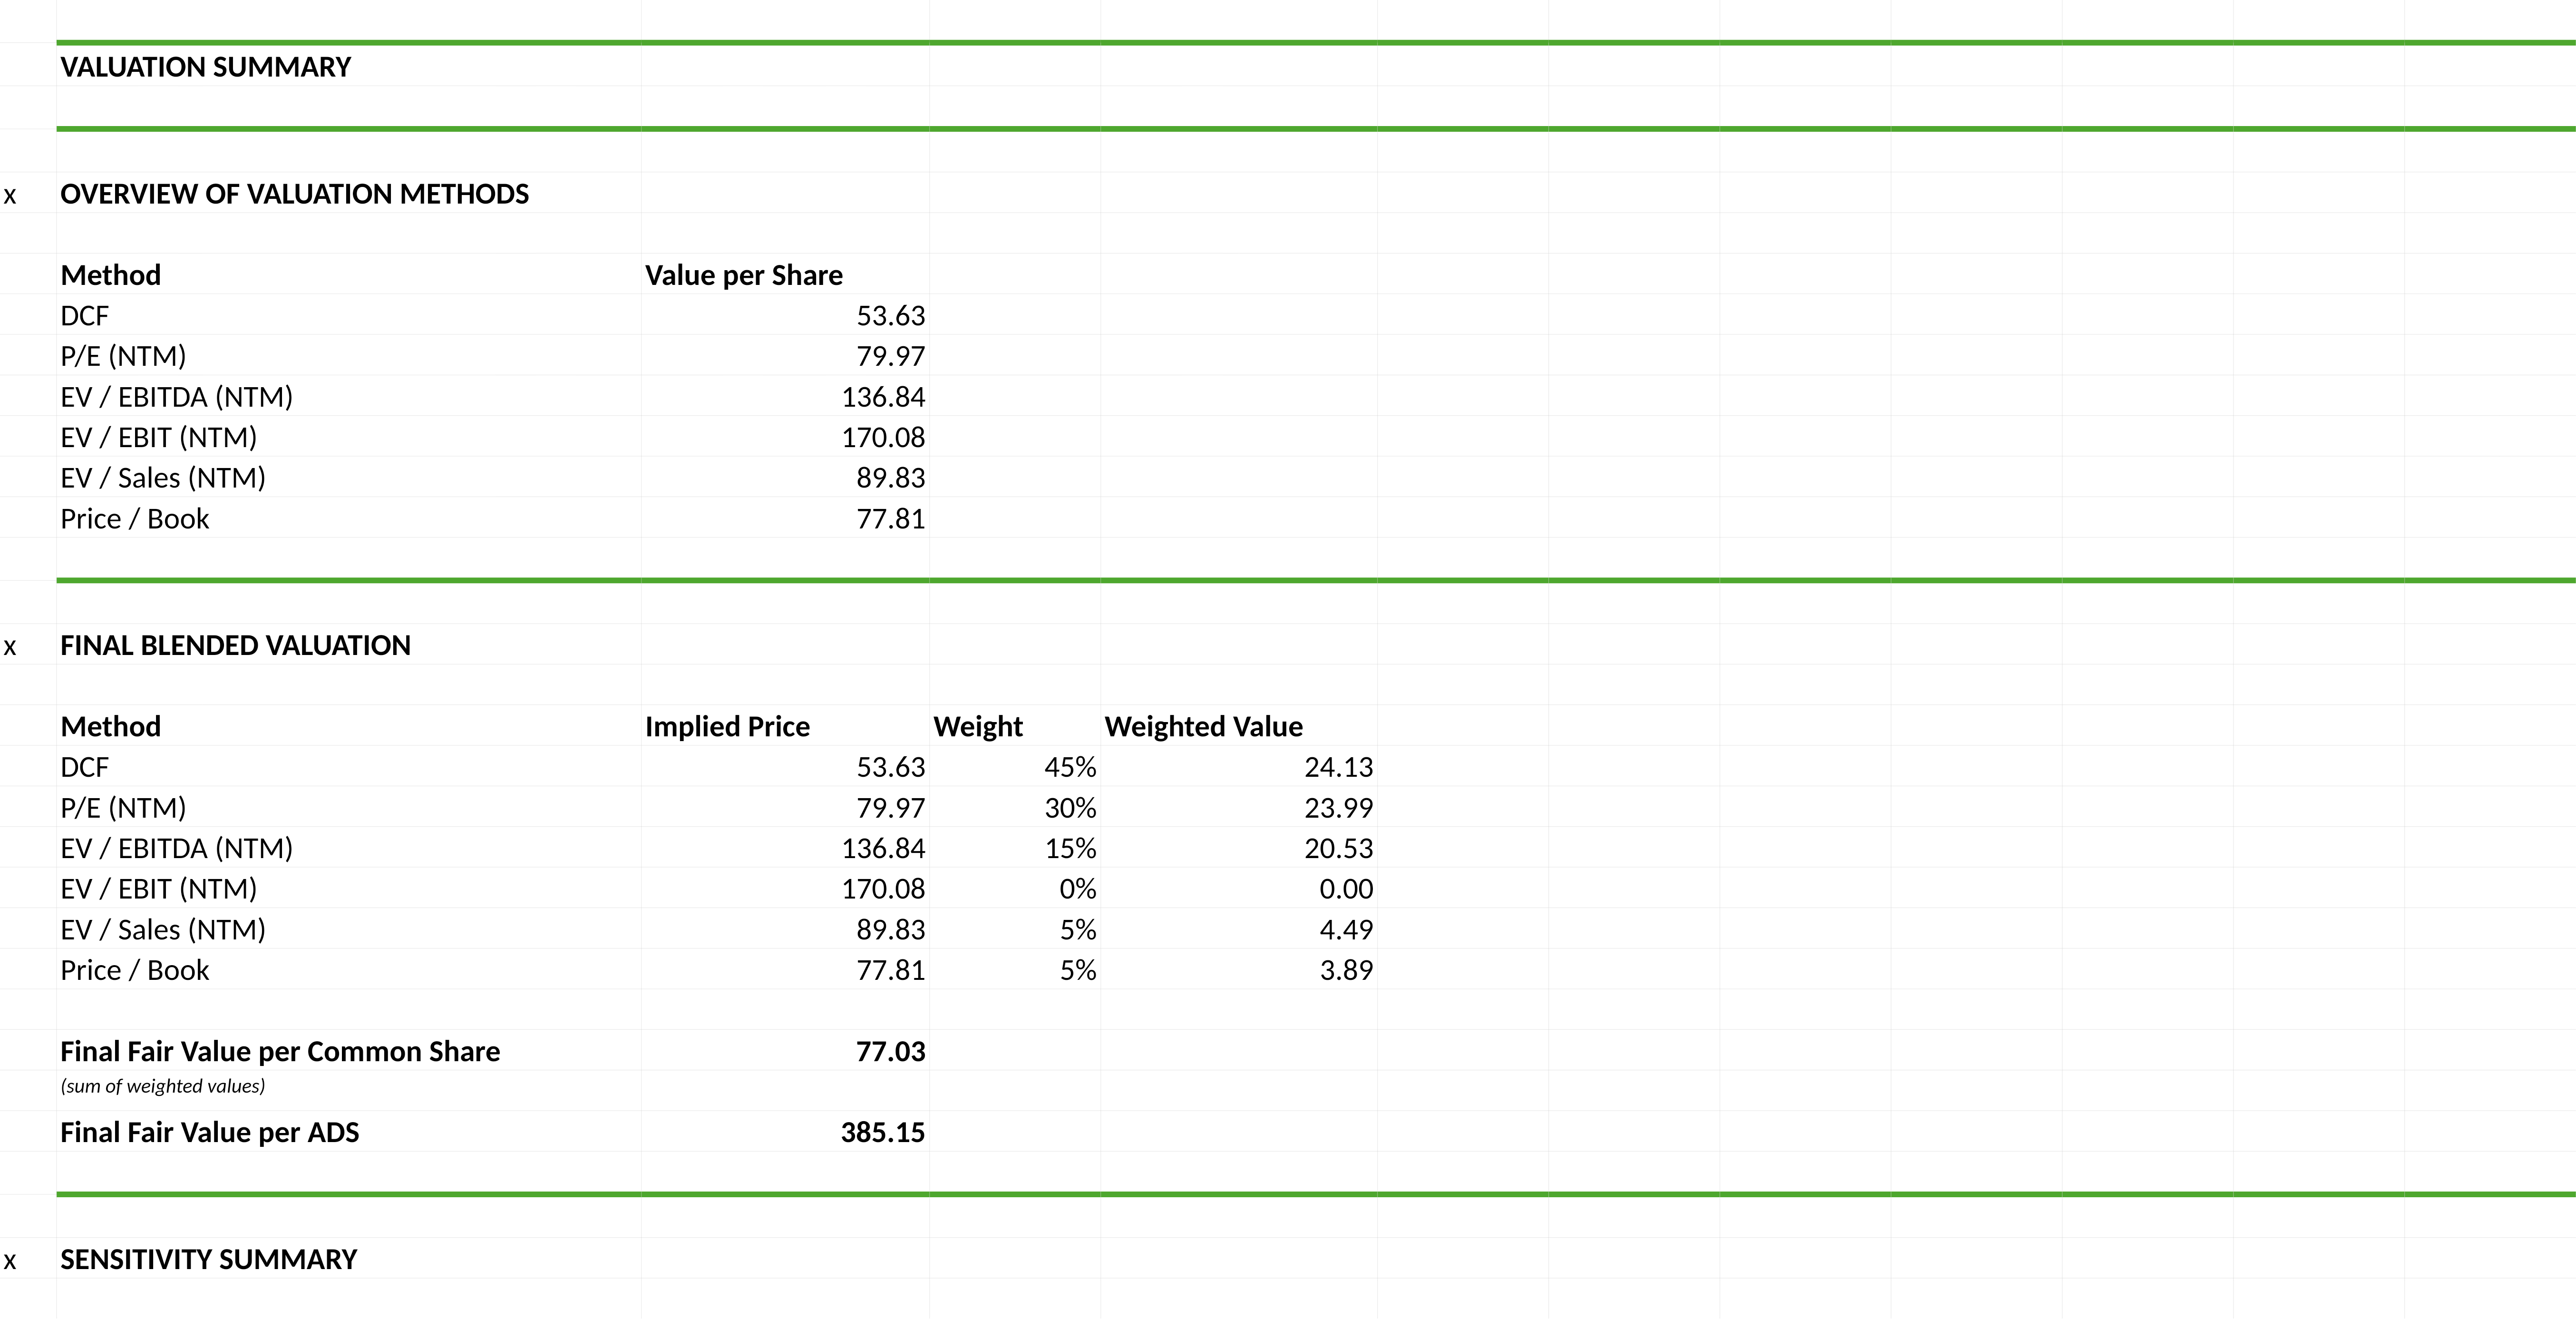
DCF, trading comparables, sensitivities and blended output.
12 interconnected worksheets · forecast assumptions are centralized in a dedicated assumptions tab.
Revenue increases from $121.4bn in 2025 to $301.8bn in 2030E, implying a five-year CAGR of approximately 20%.
Gross margin reaches 66% in 2026E before normalising toward 59% by 2030E as the base case assumes a gradual moderation.
Forecast FCFF rises from $46.8bn in 2026E to $112.9bn in 2030E, supported by earnings growth despite elevated capital expenditure.
Blended fair value
$385.15 / ADS
To keep the website presentation comparable, all methodology outputs above are shown on an ADS basis. The Excel model performs the underlying calculations on a common-share basis and converts the final output to ADS.
The model tests DCF value across different WACC and terminal-growth assumptions. The compact table below shows a selected 3 × 3 view from the full sensitivity analysis.
USD per common share| WACC \ g | 2.0% | 3.0% | 4.0% |
|---|---|---|---|
| 9.0% | 55.42 | 62.76 | 73.04 |
| 10.0% | 48.32 | 53.63 | 60.71 |
| 11.0% | 42.81 | 46.80 | 51.92 |
Income statement, balance sheet and cash flow statement linked through a unified forecast framework.
Dedicated PP&E, working-capital and marketable-securities rollforwards feeding the statements.
Base, Bull and Bear cases controlled from the assumptions sheet through central forecast drivers.
DCF, trading comparables, weighted valuation output and sensitivity analysis in one workbook.
Balance-sheet checks and iterative cash / interest calculations support model integrity.
ReadMe and centralized assumptions make the workbook easier to review, navigate and update.
Full workbook
The Excel workbook includes all 12 interconnected worksheets, historical financials, forecasts, supporting schedules, DCF, trading comparables and sensitivities.
Historical financial data is based on TSMC 20-F filings for 2021–2025. Market data in the model is as of 14 August 2026. Forecasts and valuation assumptions reflect my own modelling assumptions.
This model was created for educational and portfolio purposes only and does not constitute investment advice.