Python pipeline
End-to-end workflow from data preparation through estimation, forecasting, tables and figures.
Empirical Asset Pricing · Python · 2026
Testing whether macroeconomic state dependence in factor exposures and premia translates into better real-time forecasts of U.S. industry returns.
State dependence is detectable. Real-time forecastability is not.
Does conditioning a standard factor model on a predetermined macroeconomic stress regime improve real-time forecasts of industry returns?
49 industry portfolios and the six FF6 factors.
Predetermined NORMAL / STRESS classification.
Unconditional FF6 versus regime-conditional FF6.
Expanding-window next-month industry forecasts.
Forecast errors, rank IC and portfolio illustration.
Every out-of-sample forecast is formed using parameters and information available before the return month.
No look-ahead information enters the forecast.
Return month t is assigned the latest Sahm observation that would have been observable under the study's information-timing convention, using the reading from t−2.
Regime information available before forecast formation.
Model parameters are estimated only through the prior month.
The forecast is evaluated only after the return is observed.
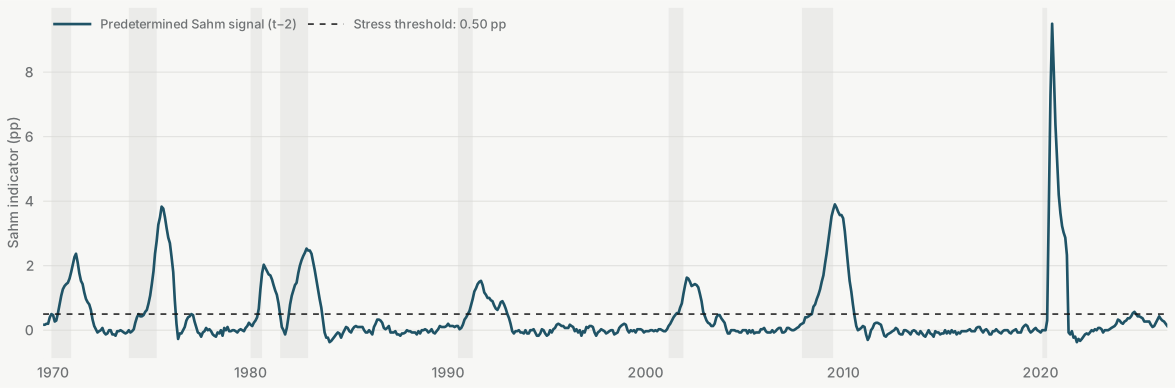
The conditional specification identifies statistically meaningful state dependence in a subset of industries, a pronounced change in the SMB premium, and lower in-sample pricing errors.
industries remain significant after Benjamini-Hochberg FDR control at 5%.
−0.109% per month in NORMAL versus +0.835% in STRESS.
conditional FF6 versus 0.479% for unconditional FF6.
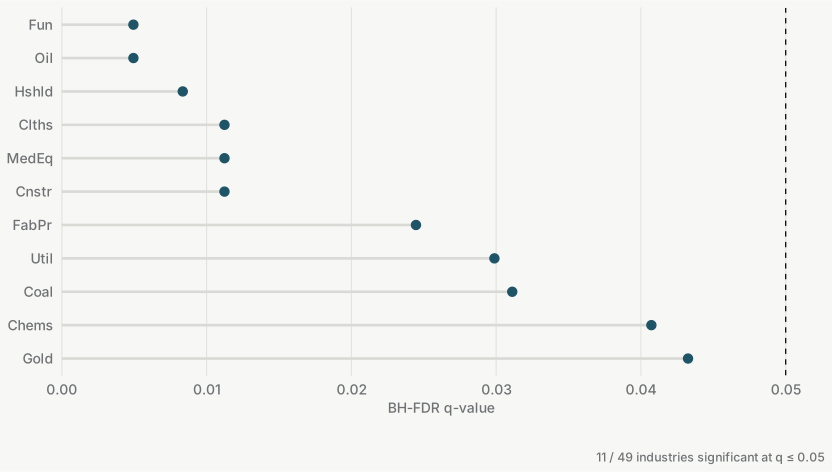
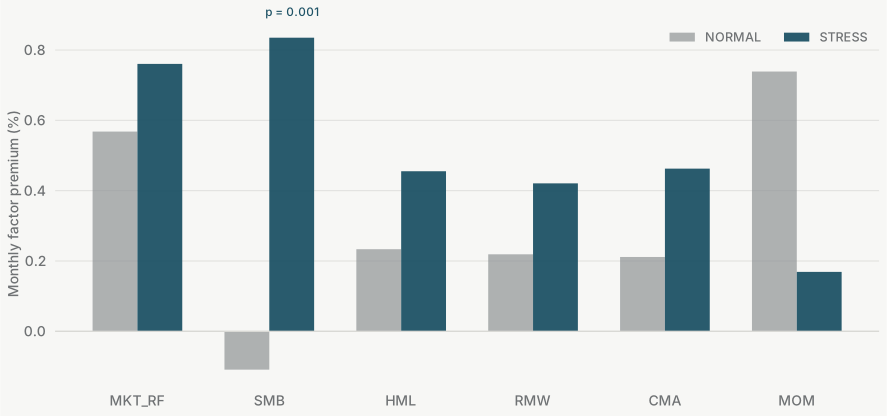
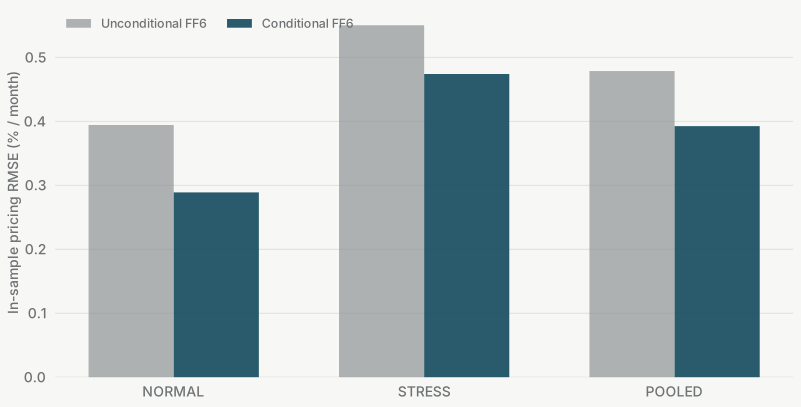
Conditioning improves the description of realized returns in sample. The harder question is whether those relationships remain useful when the regime and all model parameters must be estimated in real time.
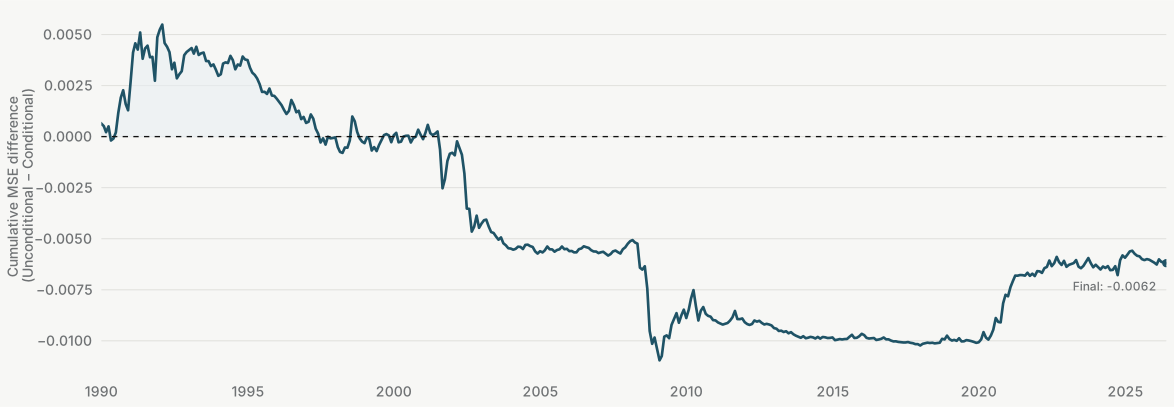
Across 21,413 industry-month predictions, the conditional FF6 model delivers slightly higher aggregate forecast errors than the unconditional benchmark and essentially no cross-sectional ranking ability.
real-time OOS forecast error.
benchmark OOS forecast error.
relative to unconditional FF6.
one-sided HAC test.
Central finding
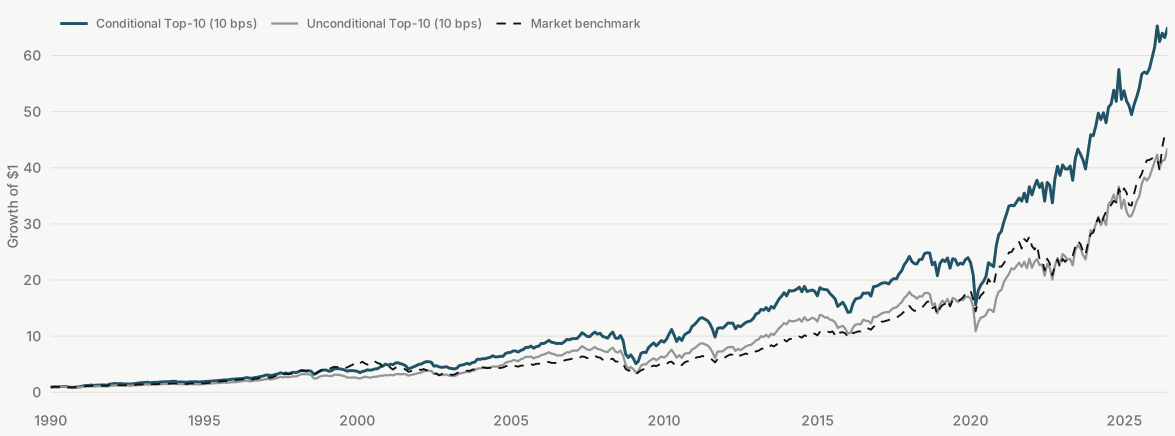
Higher raw returns in the illustrative conditional Top-10 portfolio do not translate into statistically significant positive factor-adjusted abnormal performance.
The core forecasting conclusion remains unchanged under alternative factor sets, estimation windows, test assets and regime specifications.
| Specification | OOS R² vs. benchmark | Clark-West p | Conclusion |
|---|---|---|---|
| FF5 | −0.266% | 0.384 | No improvement |
| 20-year rolling window | −0.660% | 0.510 | No improvement |
| 30 industry portfolios | −0.258% | 0.382 | No improvement |
| Continuous Sahm signal | −0.196% | 0.072 | Suggestive only |
CFNAI and NBER alternatives are treated as ex-post / in-sample robustness checks rather than real-time forecasting exercises.
End-to-end workflow from data preparation through estimation, forecasting, tables and figures.
437 sequential forecast months evaluated with an expanding historical information set.
Explicit timing controls ensure the regime and estimated parameters precede the forecast return.
HAC inference, Wald tests and Benjamini-Hochberg false-discovery-rate control.
Alternative factor sets, estimation windows, test assets and macro-state definitions.
Research tables, diagnostics and website figures are generated programmatically from project outputs.
Full research
The full Research Note contains the methodology, statistical evidence and robustness analysis. A shorter Executive Summary provides the research question, design and principal findings at a glance.
49 value-weighted U.S. industry portfolios and factor returns from the Kenneth R. French Data Library; real-time Sahm labor-market stress data from Federal Reserve Economic Data.
Full sample: July 1969–June 2026. Real-time out-of-sample evaluation: January 1990–June 2026. The six-factor specification combines the Fama-French five factors with momentum.
Independent empirical asset-pricing research project. Results on this page are condensed from the full Research Note and are presented for academic and portfolio purposes only, not as investment advice.